
The Hidden Price Tag: Why Two Identical Houses Can Carry Very Different Tax Futures
Date Published
Most homebuyers compare the list price, mortgage rate, insurance premium and current property-tax bill. Those numbers matter, but they leave one major cost largely unlabeled: the future fiscal pressure of every local government attached to the address.
Buying a house is therefore two transactions at once. The buyer acquires land and a structure, but also joins a public-goods bundle that may include a city, county, school district, park district, library district, fire or transit authority, and other special-purpose entities. Each one has its own spending path, revenue base, reserves, debt and long-term promises.
THE CORE IDEA The hidden price tag is not today's tax bill. It is the forward-looking cost pressure embedded in the public-goods bundle serving the property. Spending Pressure® is best read as a tax-price signal - not a tax quote. |
The comparison at a glance
Metric | Chicago | Naperville | What changes |
Spending Pressure® score | 85 | 46 | Chicago +39 points |
Median home value | $334,100 | $540,200 | Naperville +$206,100 |
Spending per capita, FY2024 | $6,998 | $3,634 | Chicago +$3,364 |
Reading note: The home values are the latest U.S. Census QuickFacts median values for owner-occupied housing units (2020-2024). City medians provide context; they are not prices for literally identical homes.
The address is a public-goods bundle
At closing, the buyer receives title to the property. At the same moment, the address is placed inside a network of public budgets. Those budgets pay for services residents use directly - such as streets, police, fire protection, schools, parks and libraries - and for obligations that may be less visible, including debt service, pension contributions and deferred capital maintenance.
The point is not that spending is inherently good or bad. Public services create real value, and different communities legitimately choose different service levels. The financial question is whether the revenue base and balance sheet can support those commitments without producing escalating taxes, fees, borrowing or service trade-offs over the years a buyer expects to own the home.
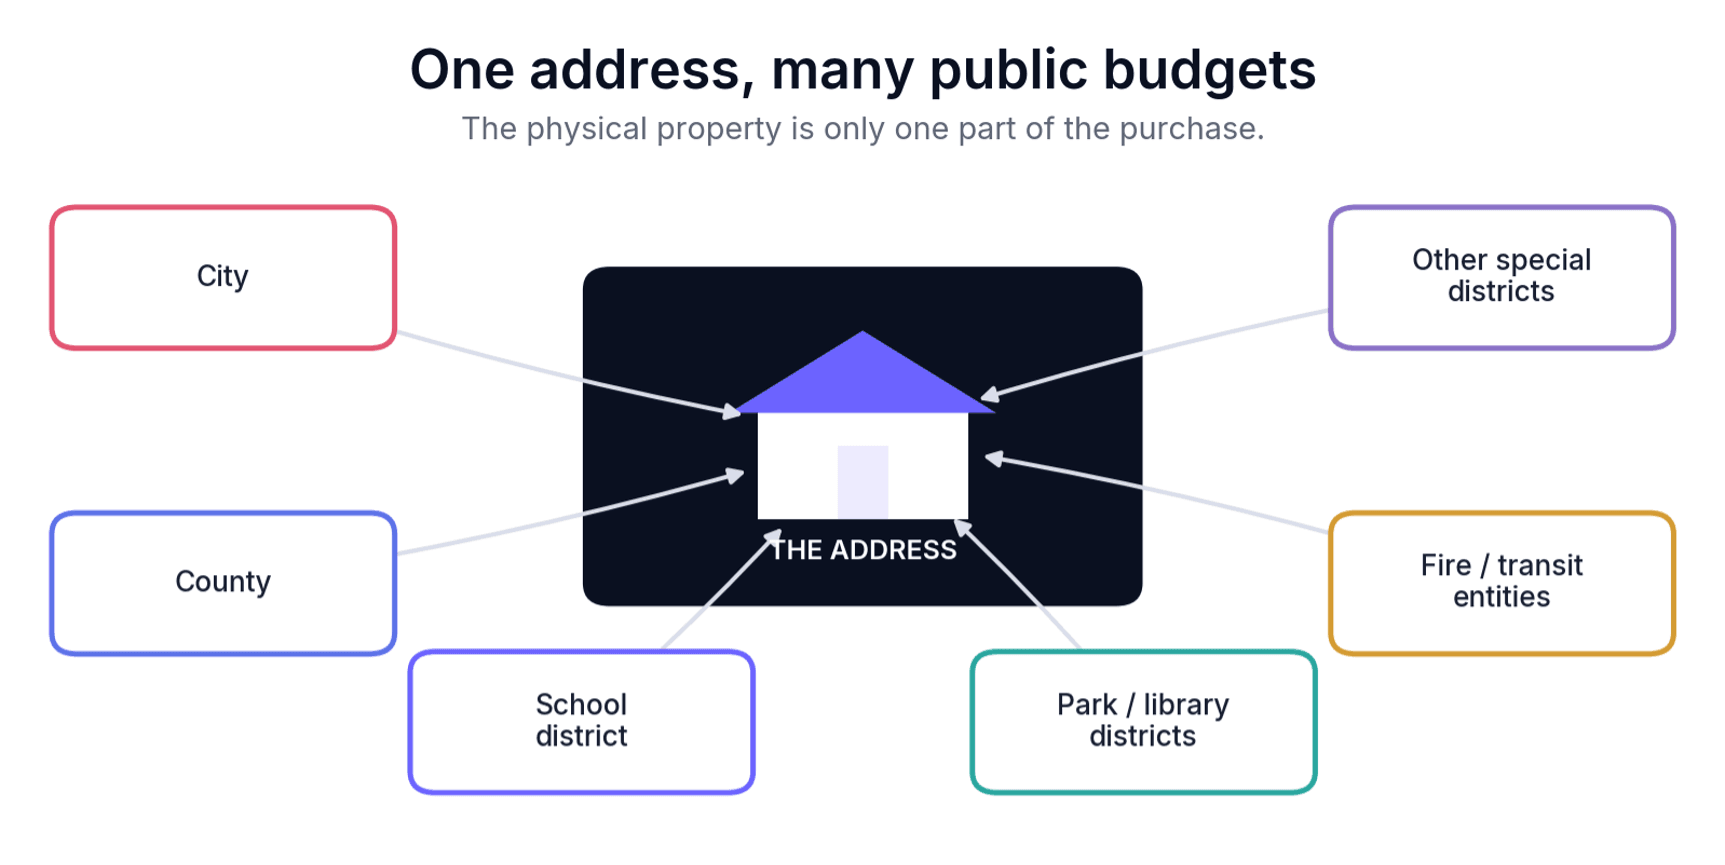
Figure 1. A property address can overlap multiple spending entities, each with a separate budget and set of obligations.
Source: Conceptual illustration by StatisNostics.
StatisNostics describes the Spending Pressure® score as revealing the hidden financial pressure local spending entities exert on an address and as predicting current and future tax burdens.[1] In practical terms, the score turns a fragmented set of public-finance signals into a forward-looking tax-price indicator that can sit beside the list price and mortgage rate.
That distinction matters. A current property-tax bill is a snapshot. It does not, by itself, show the direction of spending, the strength of reserves, the weight of long-term obligations or the fiscal condition of every overlapping entity. Spending Pressure® is not a guaranteed forecast and does not measure service quality; it tells the buyer where the future funding risk may be higher and where deeper due diligence is warranted.
The Chicago-Naperville fiscal inversion
Start with the visible real-estate price. The latest standardized Census measure places the median value of owner-occupied homes at $334,100 in Chicago and $540,200 in Naperville. Naperville's median is $206,100 higher - a premium of about 62 percent.[2][3]
Now reverse the lens. Chicago's Spending Pressure® score is 85, compared with 46 for Naperville - a 39-point gap, or roughly 85 percent. Reported FY2024 spending per capita is $6,998 in Chicago and $3,634 in Naperville, putting Chicago about $3,364, or 93 percent, higher on that measure.[4]
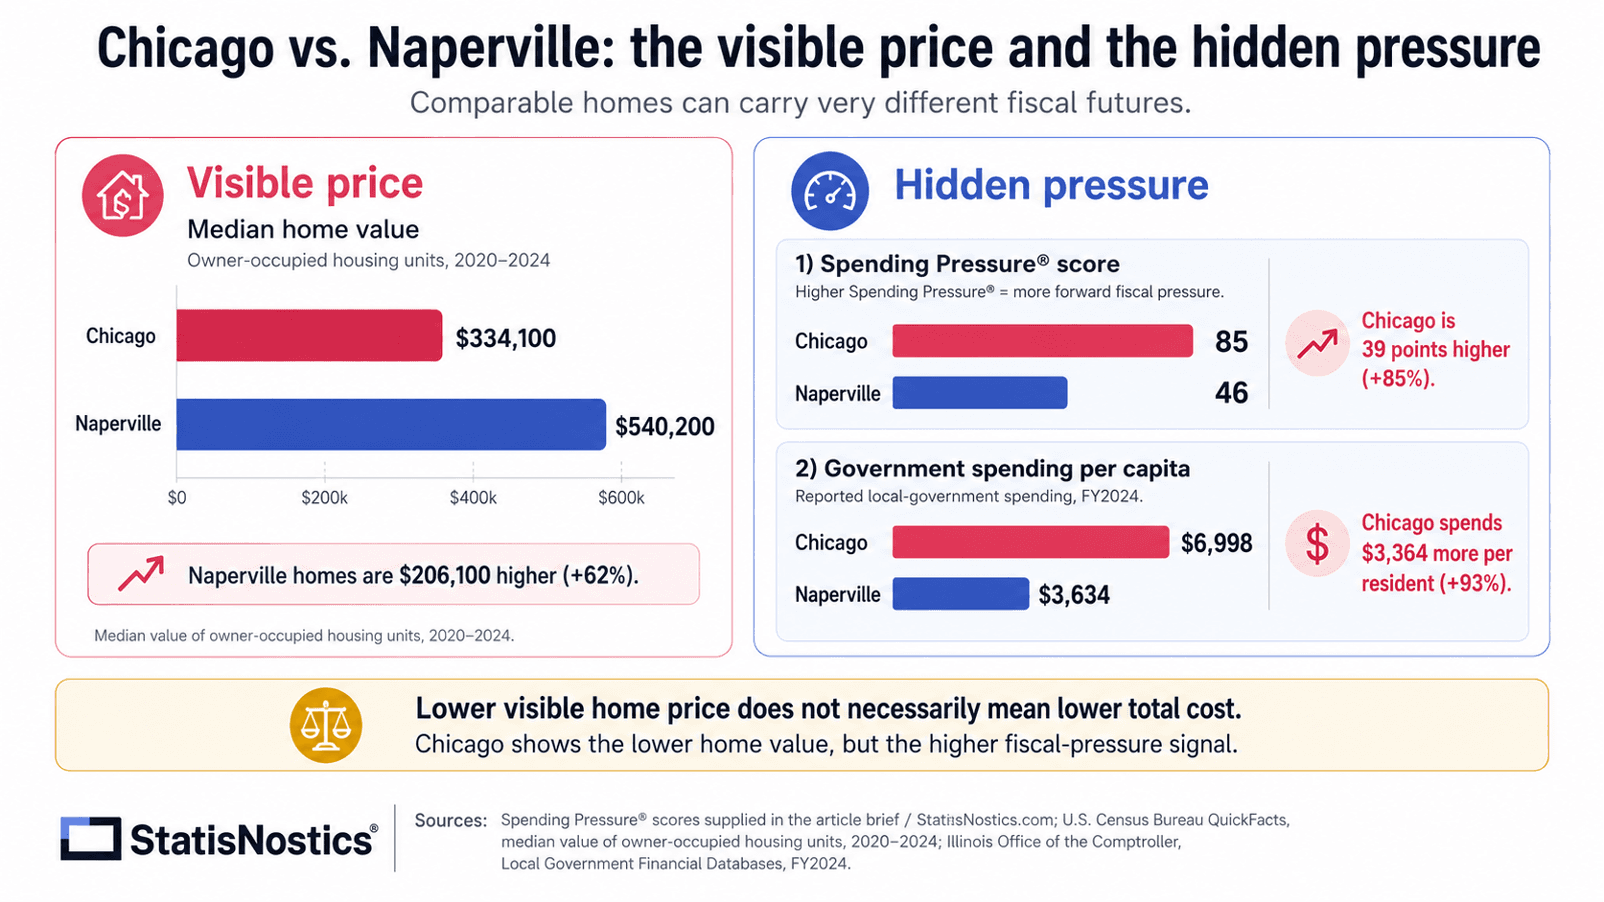
Figure 2. The market-price comparison and the fiscal comparison point in opposite directions.
Source: Spending Pressure® scores supplied in the article brief; U.S. Census Bureau QuickFacts; Illinois Office of the Comptroller, FY2024.
This is the fiscal inversion: the lower-value housing market in the pair carries the higher fiscal-pressure signal and the higher spending intensity. A buyer who looks only at acquisition price can therefore mistake a lower entry cost for a lower total cost. The two are not the same. A home's market price reflects location, housing mix, amenities, schools, commute, scarcity and many other preferences; the future claims of local public budgets are harder to observe and may be imperfectly priced.
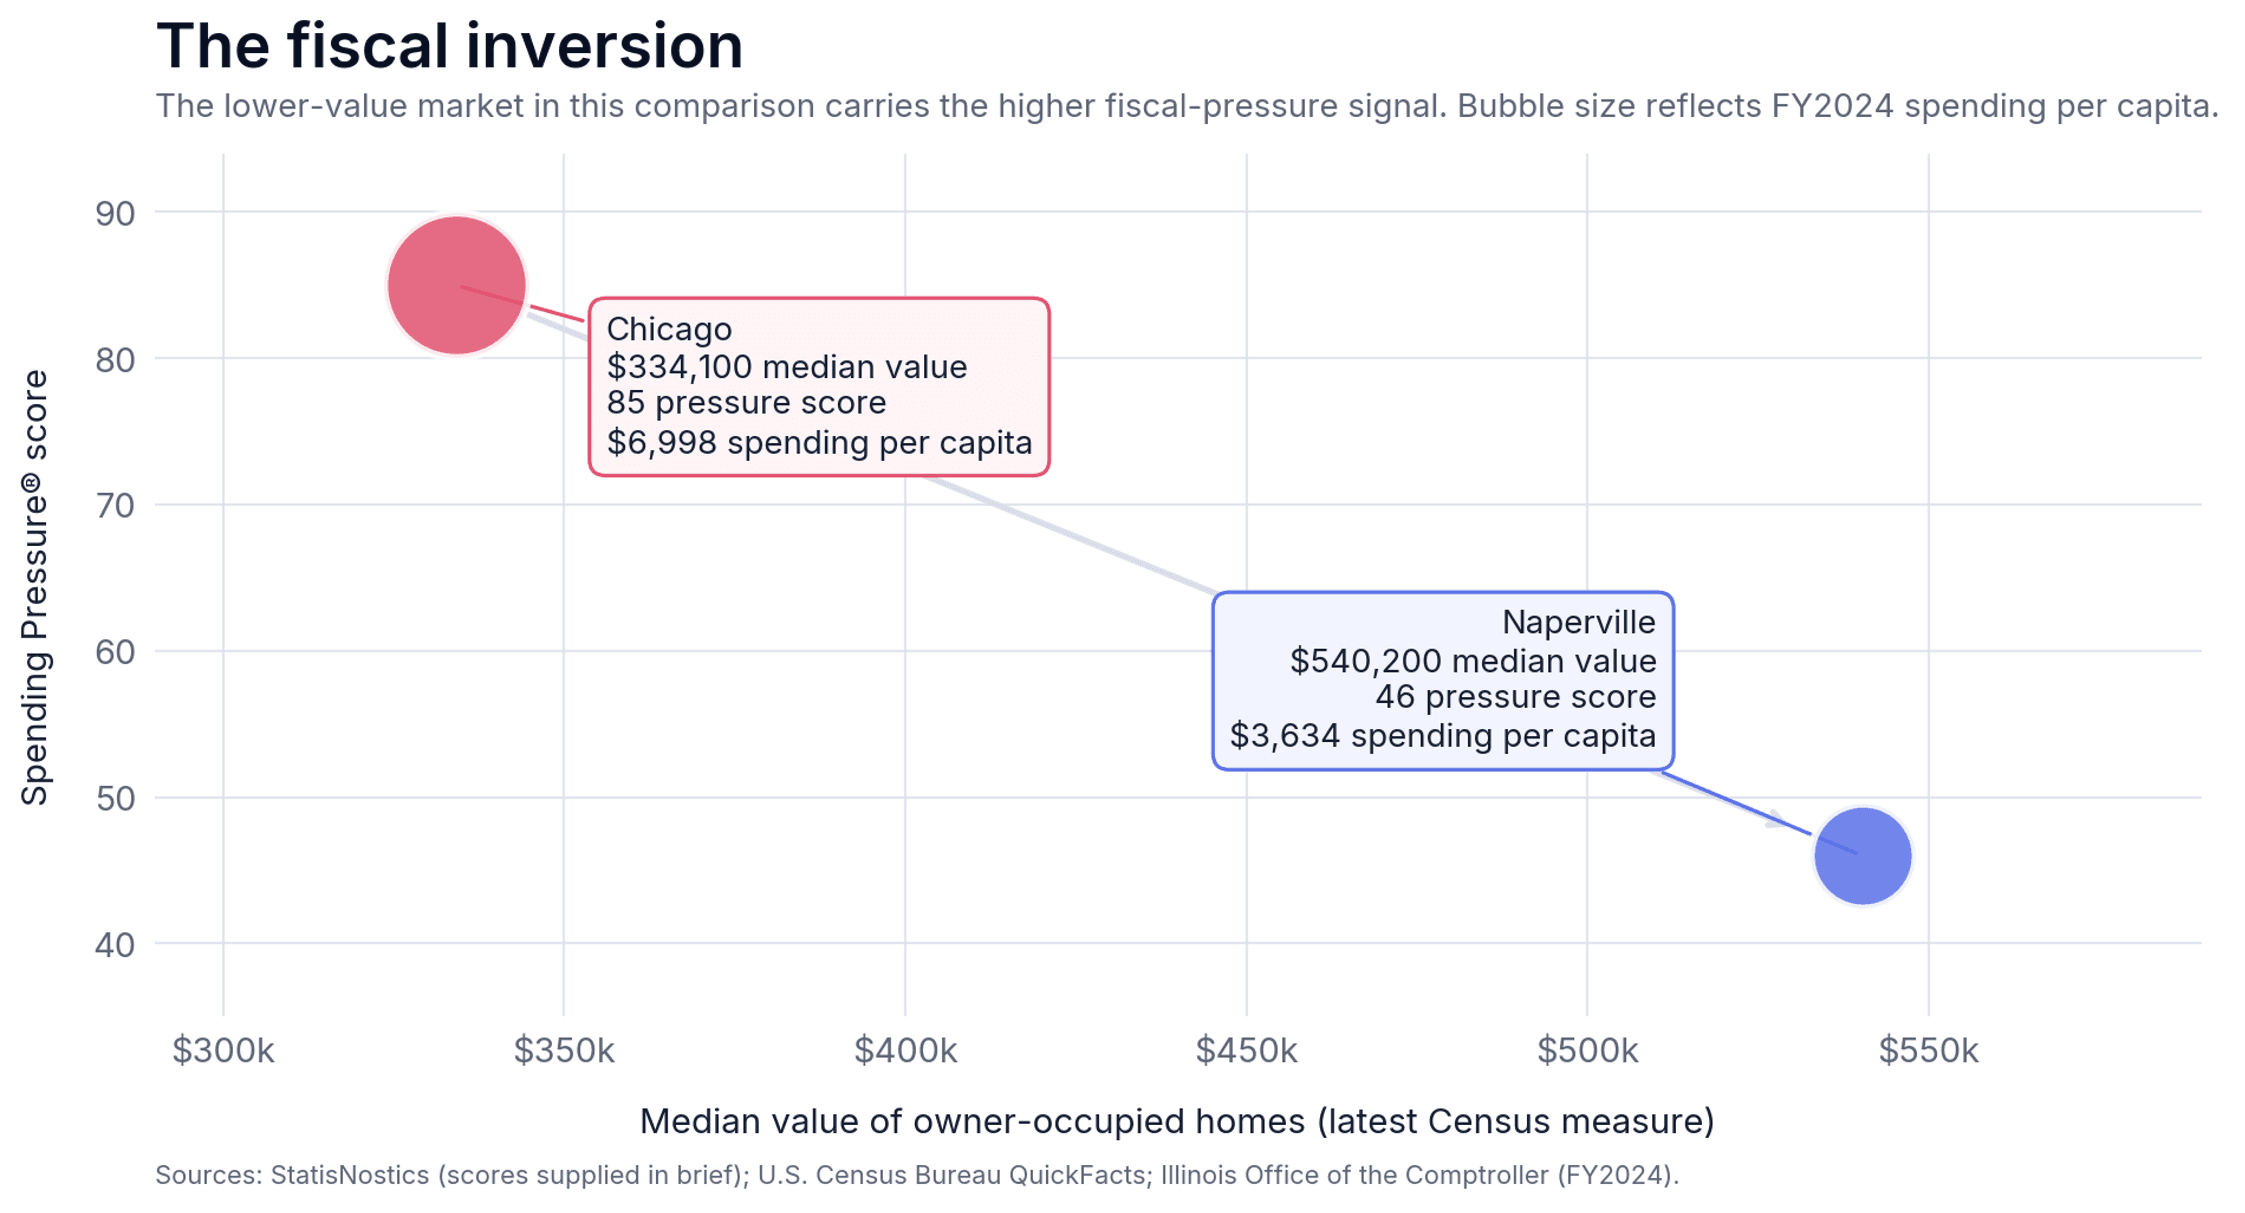
Figure 3. Home value moves right while Spending Pressure moves down. Bubble size represents reported FY2024 spending per capita.
Source: StatisNostics; U.S. Census Bureau QuickFacts; Illinois Office of the Comptroller, FY2024.
READ THE COMPARISON CORRECTLY These figures are not a verdict on service quality, and they do not establish that a particular Naperville homeowner pays less tax today than a particular Chicago homeowner. Chicago and Naperville differ in scale, density, responsibilities, housing mix and service demands. The useful conclusion is narrower: current housing price and current tax bill do not reveal the full direction of an address's fiscal pressure. |
Why Tiebout's market needs a better price label
In 1956, economist Charles Tiebout described a market-like process for local government. Consumer-voters sort across communities, choosing the combination of public services and taxes that best matches their preferences. Moving - or deciding not to move - becomes the market test for the local public-goods bundle.[5]
The idea is powerful, but it depends on informed comparison. In the private side of a home purchase, information is organized for the buyer: square footage, inspection results, comparable sales, annual percentage rate, insurance estimates and closing costs. The public side is usually scattered across budgets, annual financial reports, pension valuations, debt schedules, school filings and special-district records. Even a diligent buyer may not know every entity attached to the address, much less how to combine their fiscal trajectories.
That gap creates information asymmetry. Listings show the house; mortgage disclosures show the financing; the current tax bill shows one point in time. None of those documents provides a consolidated estimate of the public-sector cost pressure likely to follow the buyer through the holding period. When buyers treat two fiscal bundles as equivalent because the difference is hidden, they can bid as though the future tax price were the same.
In a fiscally stressed district, that can produce overpayment relative to the price that a fully informed buyer would offer. The adjustment may arrive later through higher taxes or fees, slower service growth, deferred maintenance, additional borrowing or a resale discount as future buyers become more cautious. These are possible channels, not predictions for a specific property. The economic point is that an unlabeled risk cannot be priced efficiently.
Information asymmetry breaks the sorting mechanism. |
Tools that reveal the true fiscal bundle do more than help one buyer. They improve the market for local government itself. Better-informed households can sort more intentionally; communities receive clearer feedback about the price residents place on services and fiscal stewardship; and home prices can more accurately reflect both the private asset and the public obligations attached to it.
The homebuyer's new three-price test
A complete comparison should put three prices on the same page. Each answers a different question, and none substitutes for the others.
1 STICKER PRICE What the buyer pays for the private asset: land, structure, location and amenities. | 2 FINANCING PRICE What the buyer pays to acquire it over time: interest, insurance, closing costs and loan terms. | 3 FISCAL PRICE What the address may require through local taxes, fees and public-sector cost pressure over the holding period. |
A practical workflow before making an offer
• Start with the exact address. A city average is only context. School, library, park, fire and special-district boundaries can change the entity stack from one property to another.
• Open the full entity stack. Identify every government serving the property rather than stopping at the municipality and county.
• Read pressure beside service value. A higher score is a reason to investigate funding capacity and trajectory, not a standalone judgment about whether the services are worthwhile.
• Stress-test the holding period. The longer the expected ownership period, the more important future tax and fee pressure becomes relative to a one-time difference in purchase price.
• Use the signal in the decision. A fiscal premium can affect the property selected, the offer price, the reserve budget or the questions asked of a broker, attorney and tax professional.
The market for local government works better when the tax price is visible
The Chicago-Naperville comparison does not say that one city is universally better. It demonstrates why a single real-estate number cannot carry the entire decision. Naperville's higher median home value may reflect amenities, schools, housing mix, scarcity and buyer demand. Chicago's lower median expands the range of entry prices, but the data in this brief pair it with substantially higher Spending Pressure® and spending per capita. The buyer must decide whether the public bundle is worth the private price - and whether its funding path is sustainable.
Tiebout imagined informed consumer-voters choosing among local-government bundles. Information about future fiscal burdens is the missing label. When that label is absent, buyers can overpay for homes in stressed districts and the sorting process becomes less efficient. When the label is visible, households can compare more intelligently, communities receive clearer market signals and housing prices can better reflect the whole package.
Before asking, “Can I afford this house?” add one more question: “What tax future comes with this address?” That is the hidden price tag - and it deserves a place on every comparison sheet.
BOTTOM LINE A StatisNostics Whole Address Scan is designed to place the fiscal price beside the housing and financing prices buyers already compare - making the market for local government closer to the full-information market Tiebout assumed. |
Sources and methodology
1. StatisNostics. “Spending Pressure®” description: the score reveals financial pressure exerted by local spending entities on an address and predicts current and future tax burdens. Accessed July 17, 2026. The Chicago score of 85 and Naperville score of 46 were supplied in the article brief.
2. U.S. Census Bureau, QuickFacts: Chicago city, Illinois. Median value of owner-occupied housing units, 2020-2024: $334,100. Accessed July 17, 2026.
3. U.S. Census Bureau, QuickFacts: Naperville city, Illinois. Median value of owner-occupied housing units, 2020-2024: $540,200. Accessed July 17, 2026.
4. Illinois Office of the Comptroller, Financial Databases and Local Government Warehouse. FY2024 spending-per-capita figures supplied in the brief: Chicago $6,998; Naperville $3,634. The Comptroller states that local financial data are self-reported and that the three most recent fiscal years were updated as of January 2026.
5. Charles M. Tiebout, “A Pure Theory of Local Expenditures,” Journal of Political Economy 64, no. 5 (1956): 416-424. DOI: 10.1086/257839.
Method and interpretation notes
• Percent differences are calculated from the displayed values and rounded to the nearest whole percent.
• The Census home-value measure is the latest standardized city-level median available in QuickFacts; it is not a current listing price, appraisal or monthly transaction median.
• The city comparison is illustrative. Exact address-level results can differ because overlapping school and special-district boundaries vary within and across municipalities.
• Spending per capita is not the same as a homeowner's tax bill. Spending mix, intergovernmental revenue, user fees, business tax bases and service responsibilities differ across governments.
• Spending Pressure® is an analytical signal, not a guarantee of future tax changes and not legal, tax, investment or real-estate advice.